VISUALIZING
THE
INTANGIBLE


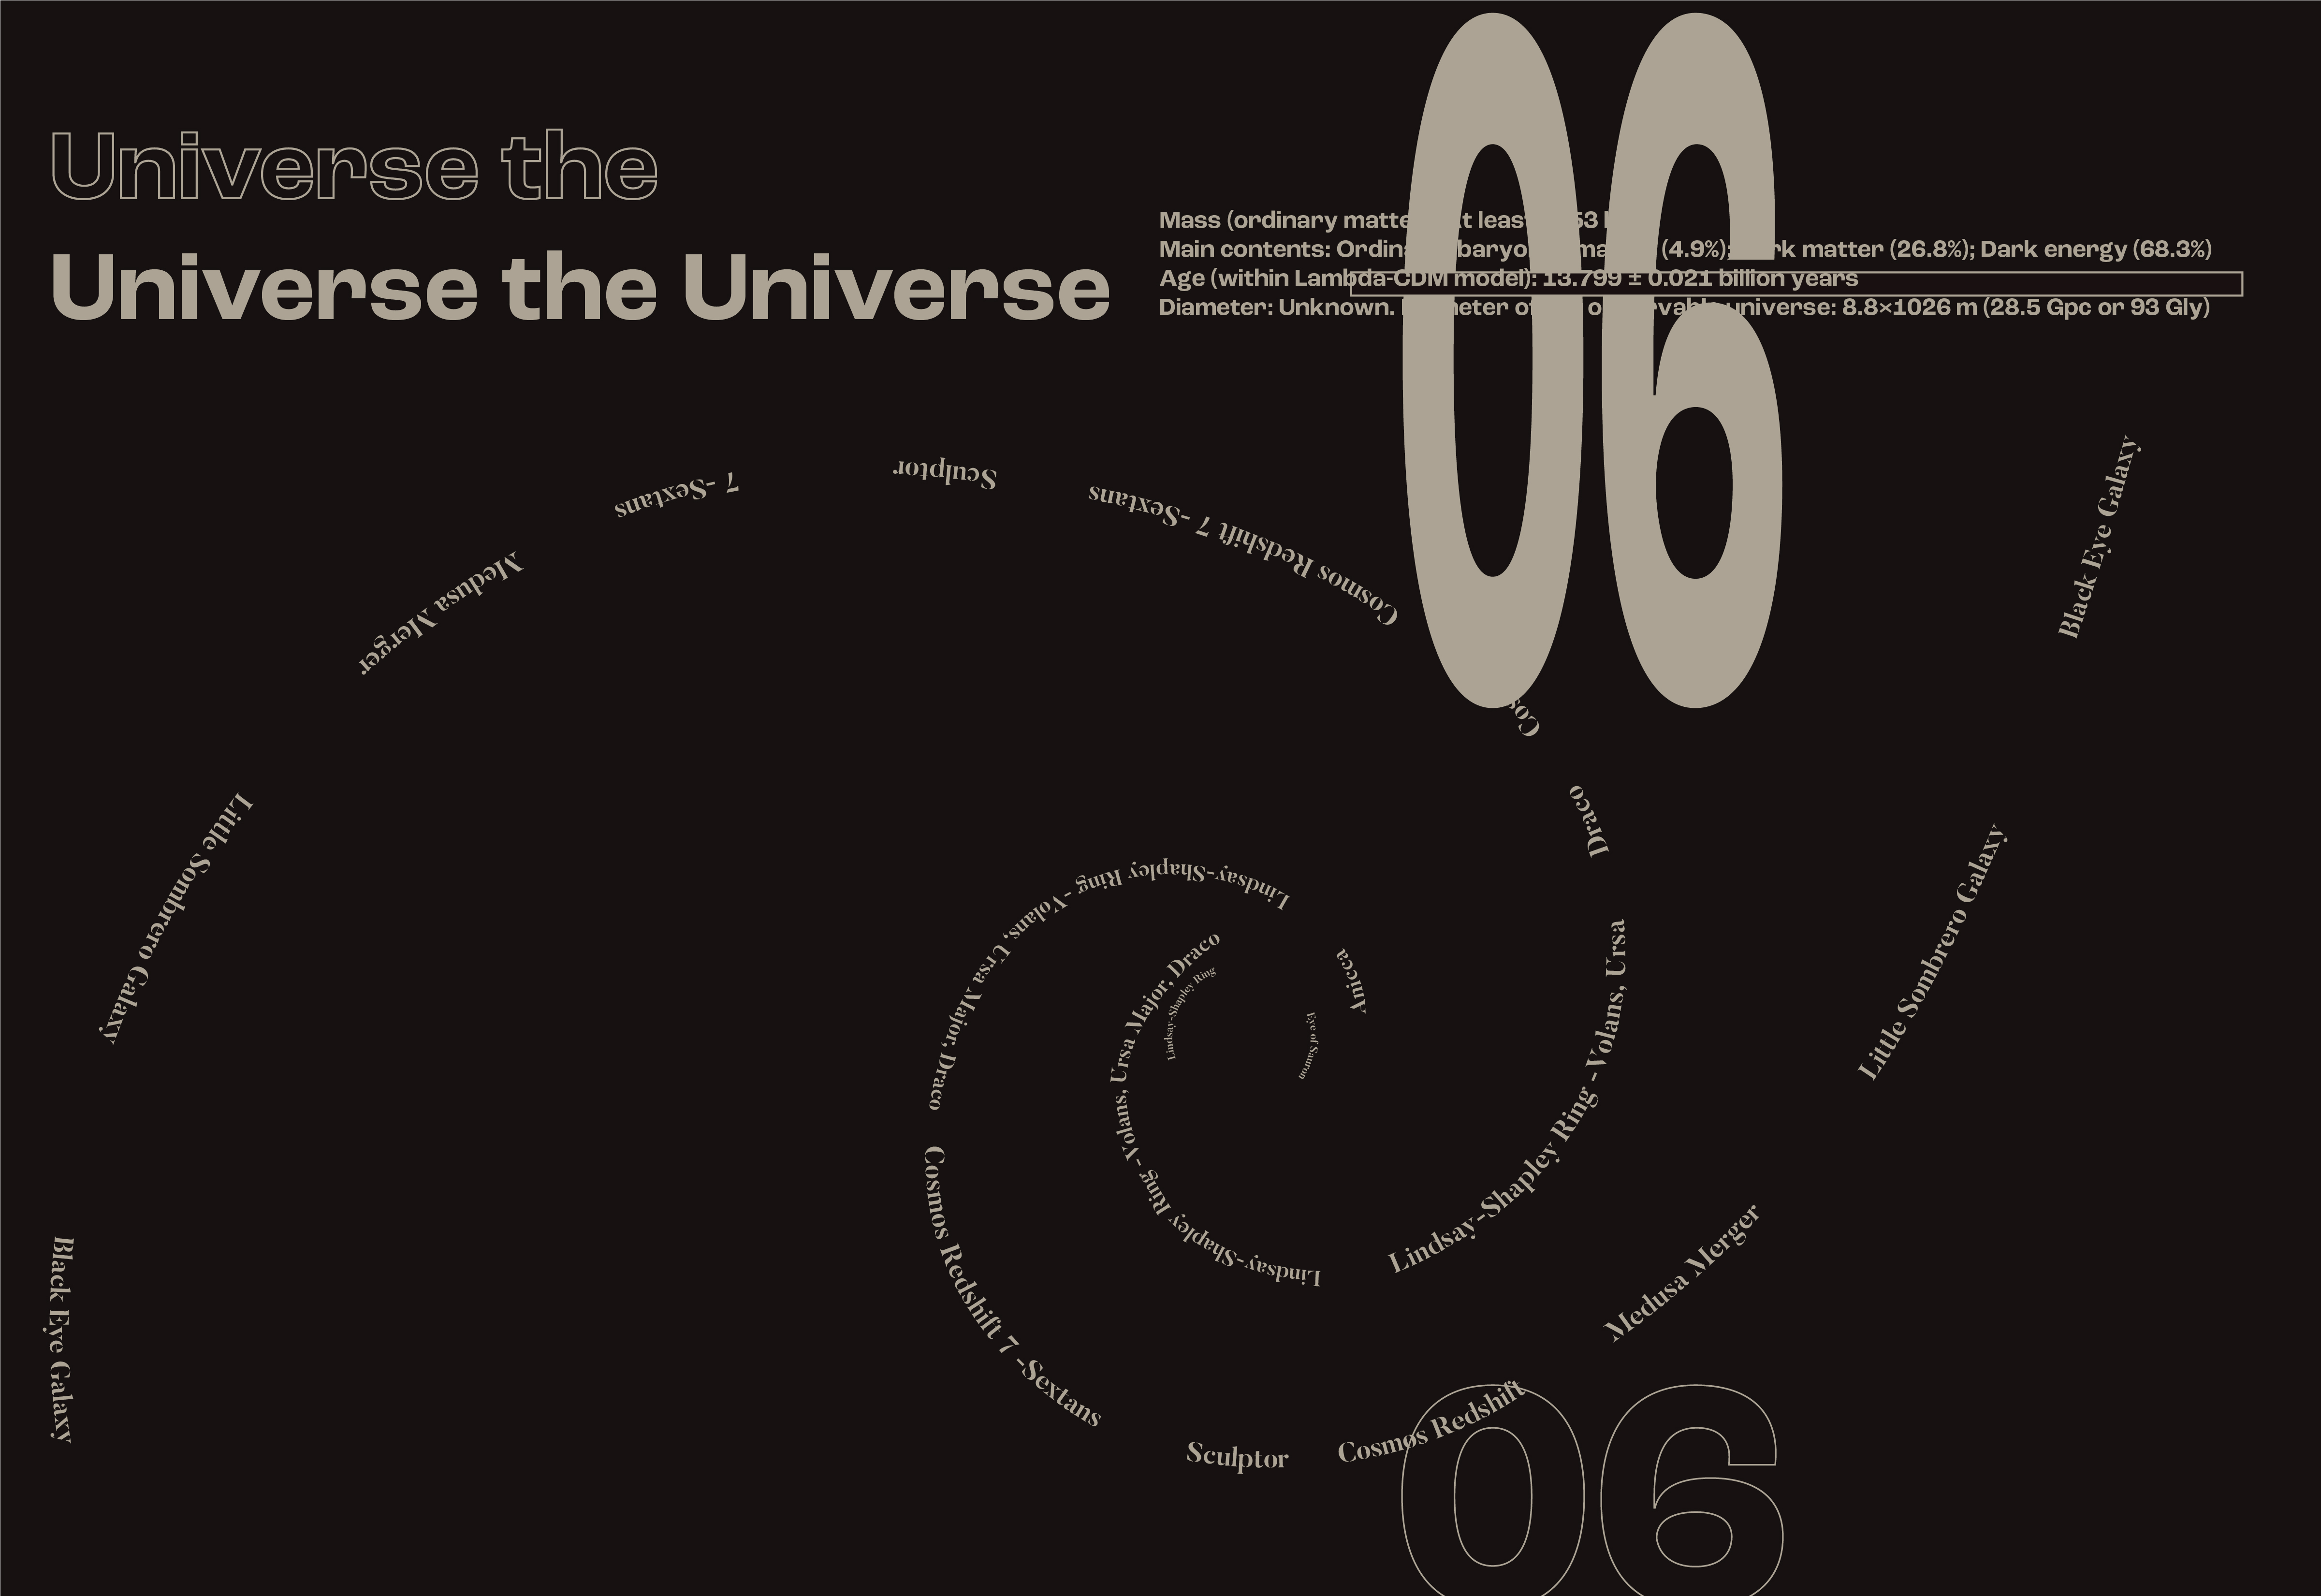
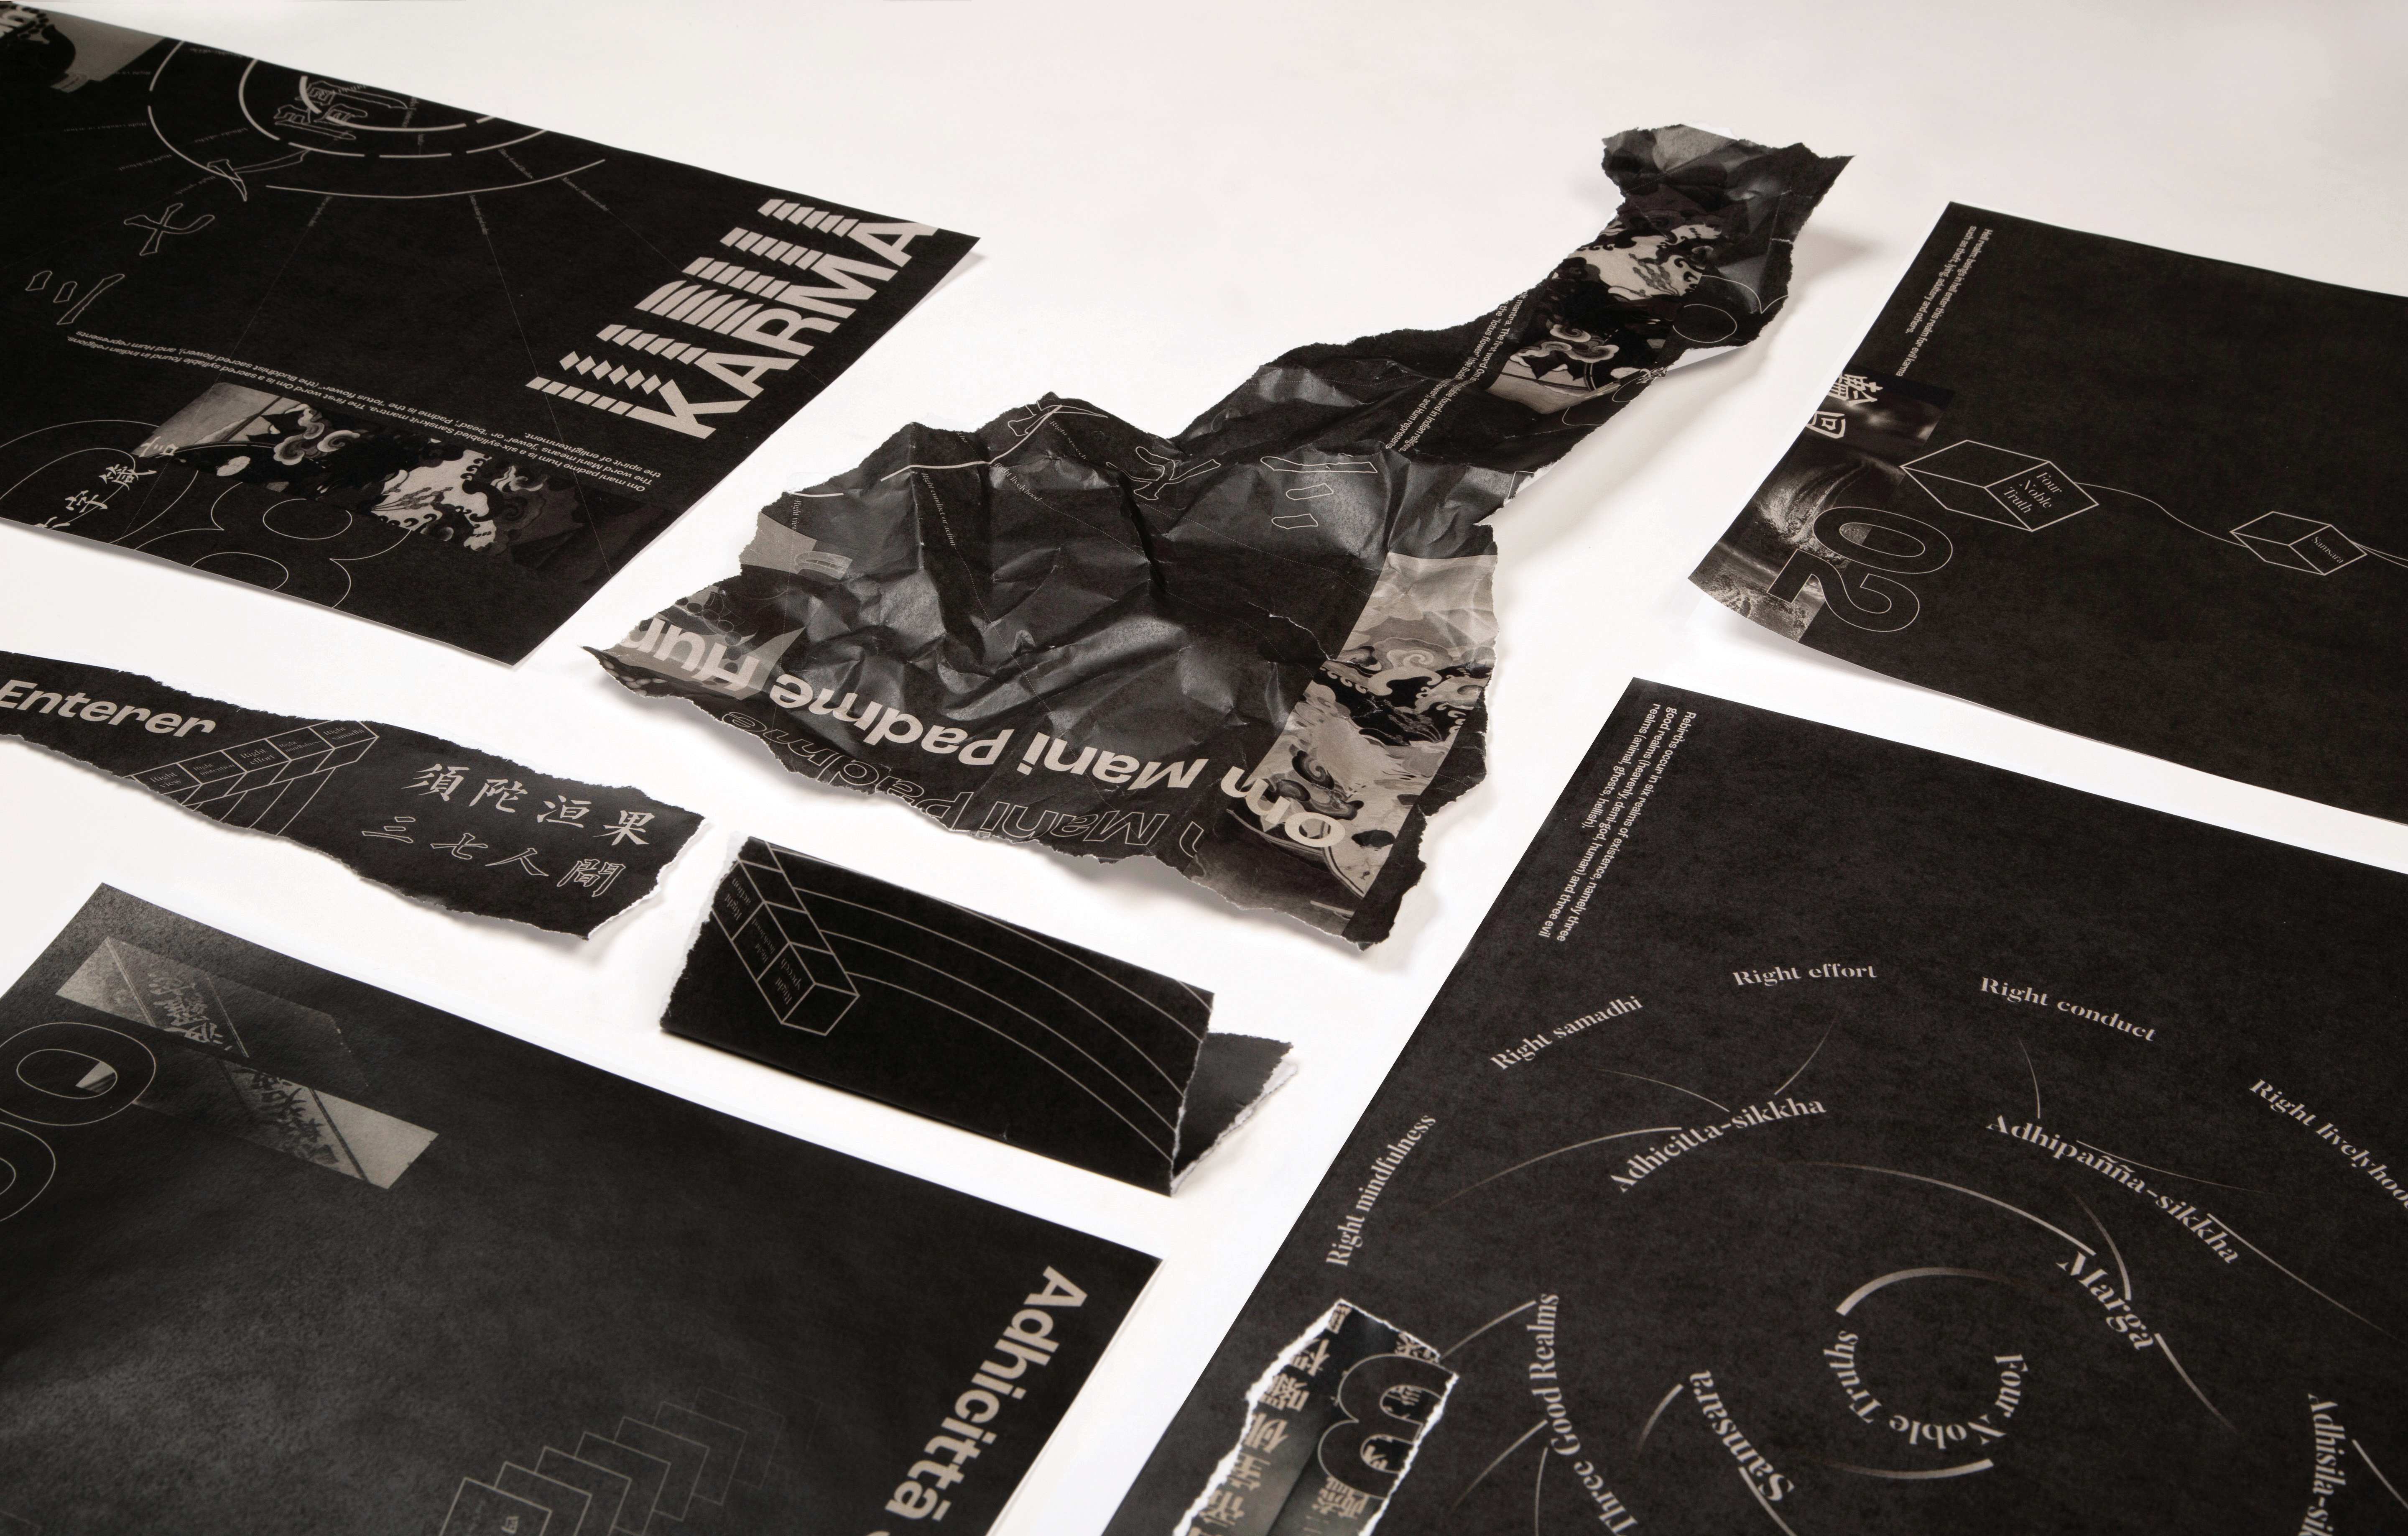
Data visualizations are often used to present tangible pieces of information and their relationship to one another. Since the medium often affects the output, I believe that experimenting with data visualization will bring new possibilities for how to explain / reveal intangible information - information that is vaguer and more abstract in definition. For example: philosophy, the universe, religion, psychology, and rules of history. Though people have distinct subjective notions about these topics, viewers could interpret the topics from a new perspective.